
Back to:
| Ordered alphabetically by REFCODE | Ordered alphabetically by Common name | Ordered by molecular formula | Grouped by family |
Cytenamide
(Last updated December 2025)
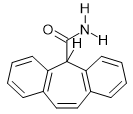
Figure 1. The molecular diagram of Cytenamide.
CSP studies
| REFCODE |
| ||
| Formula | C16 H13 N1 O1 | ||
| Common Name | Cytenamide | ||
| IUPAC Systematic Name | 5H-dibenzo(a,d)cycloheptatriene-5-carboxamide | ||
| Other Names | |||
| CSD Refcodes | SOGLEG, SODNOP | ||
| Search Identifier |
| ||
| Scientist | Rui Guo | ||
| Date | 2016 | ||
| Publication | Rui is working on it | ||
| Energy model |
| ||
| Study_ID | 10 | ||
| Programs | Flexible CrystalPredictor (2.1.01), CrystalOptimizer (2.4.m), DMACRYS (2.2.0.1) | ||
| Location on S Drive | /CHEMISTRY_CPOSS/CarbamazepineSeries/Cytenamide_CO | ||
| Potential Description | CrystalOptimizer with PBE0/6-31G(d,p) Intra and GDMA2.2(PBE0/6-31G(d,p)) + FIT | ||
| Intramolecular Description | PBE0/6-31G(d,p) | ||
| pDFT structures |
| ||
| Energy model |
| ||
| Study_ID | 30 | ||
| Programs | Study_ID=10, DMACRYS (2.2.0.1) | ||
| Location on S Drive | /CHEMISTRY_CPOSS/CarbamazepineSeries/Cytenamide_PCM | ||
| Potential Description | GDMA2.2(PCMdielectric3(PBE0/6-31+G(d))) + FIT | ||
| Intramolecular Description | PCMdielectric=3(PBE0/6-31G(d,p)) | ||
| Search Identifier |
| ||
| Scientist | Louise Price | ||
| Date | 2010 | ||
| Publication | No publication planned | ||
| Energy model |
| ||
| Study_ID | 0 | ||
| Programs | MOLPAK, DMAREL (4.1.1) | ||
| Location on S Drive | \CHEMISTRY_CPOSS\0-EarlySearches\home\louise_price.eminerals\cytenamide | ||
| Potential Description | DMA + FIT | ||
| Intramolecular Description | MP2/6-31G(d,p) | ||
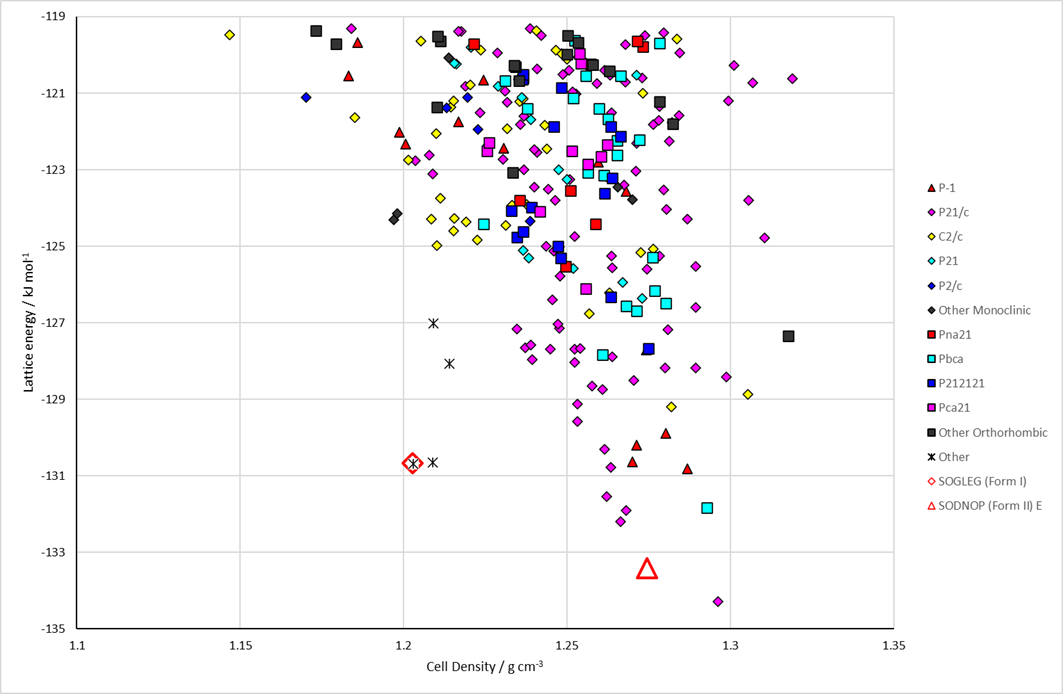
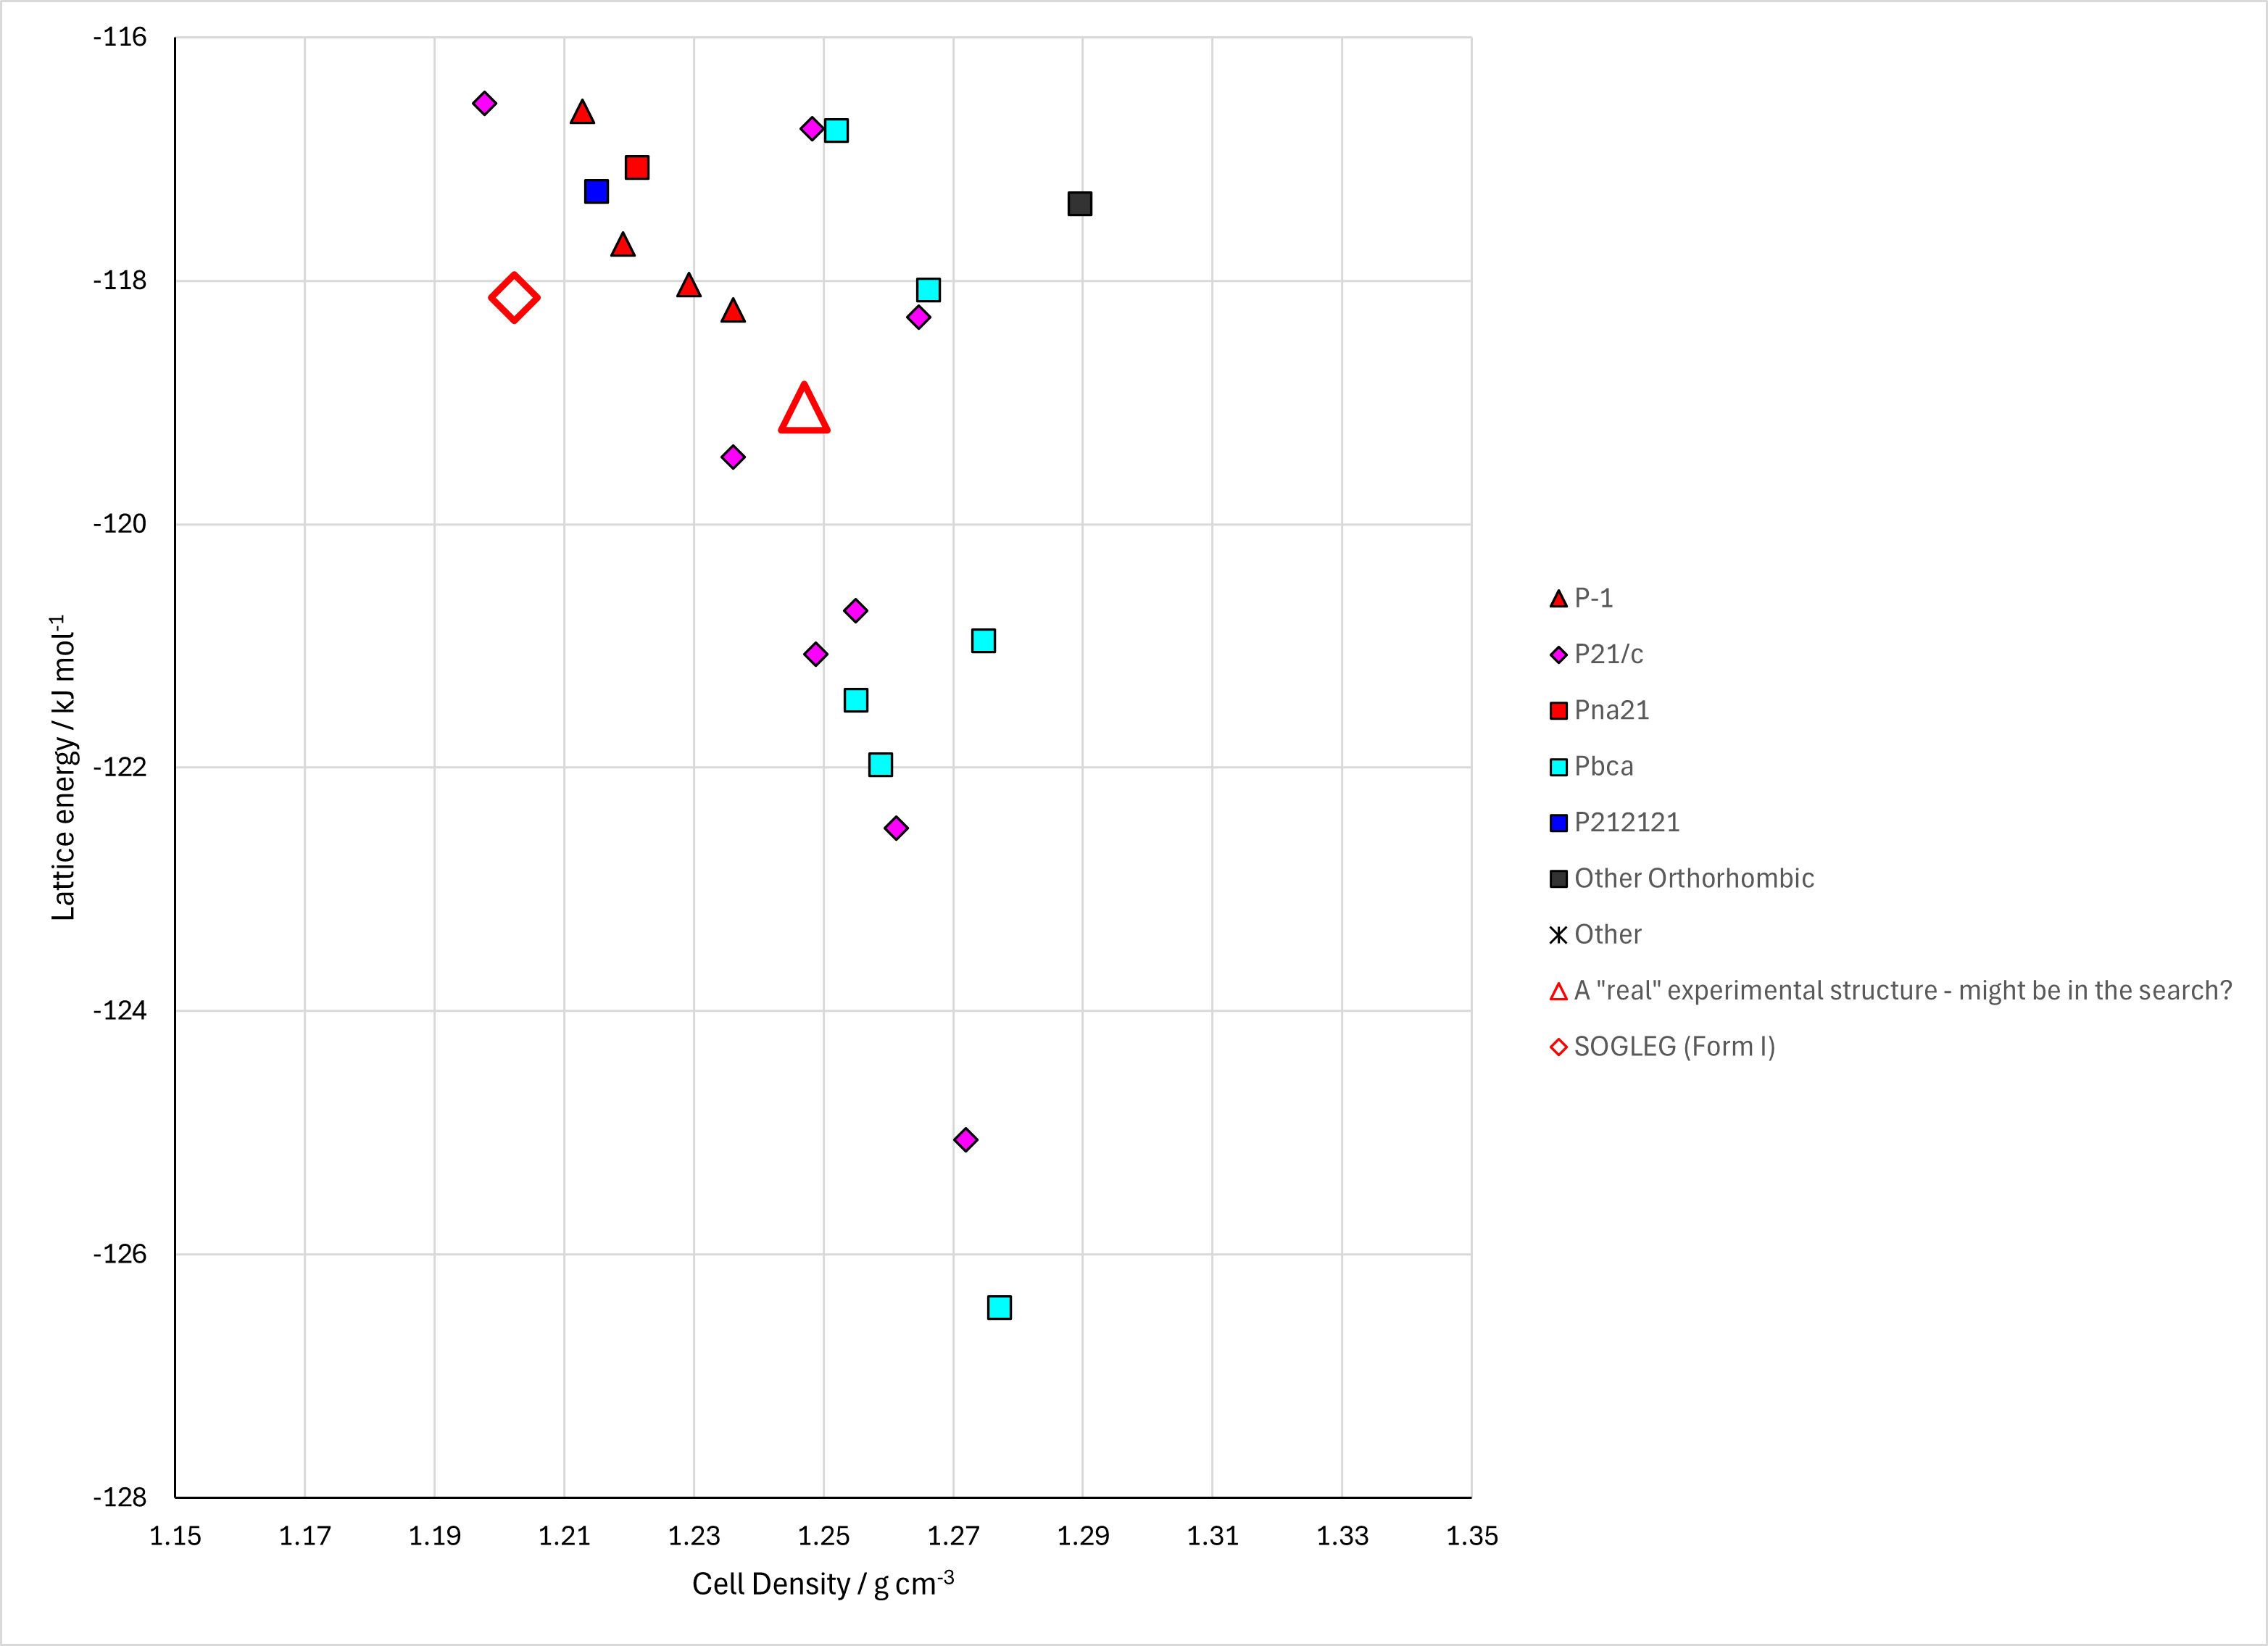
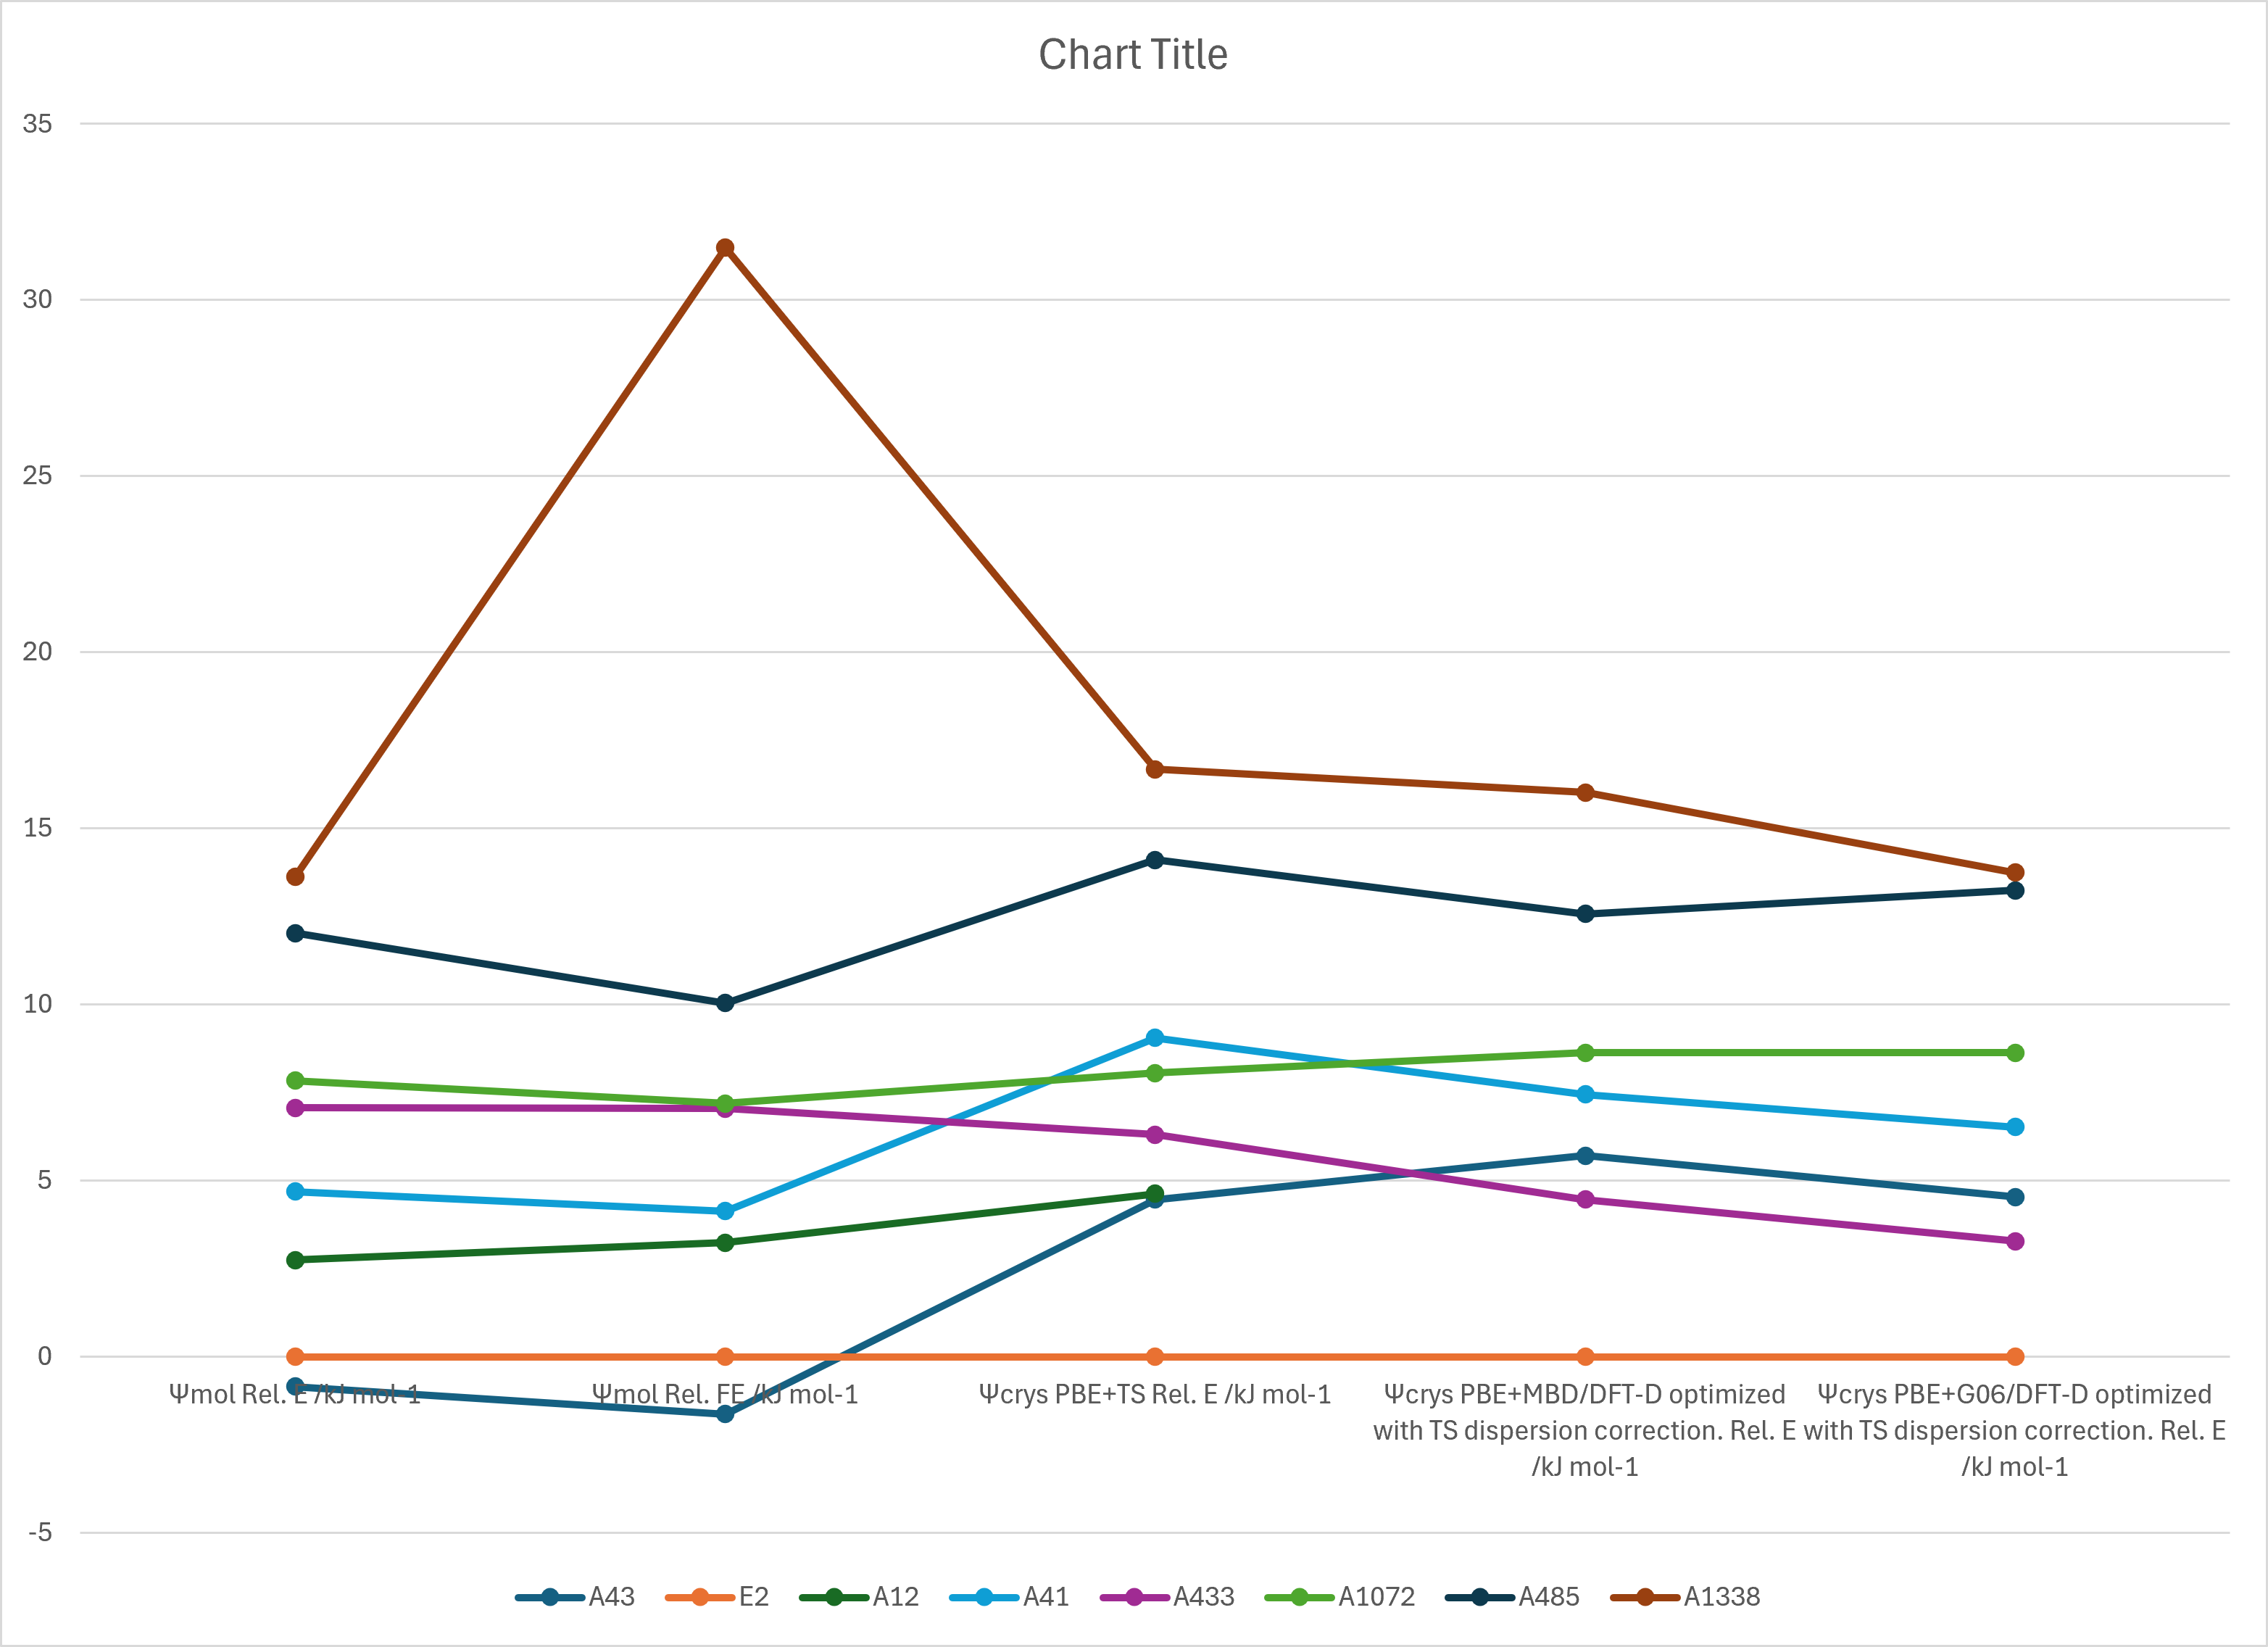
Figure 2. Lattice Energy Landscapes of Cytenamide. Energy models A1 and B1. Line chart comparing DFT+D energy models.
CSD structures (CSD version 6.01)
Table 1. Crystallographic information and experimental information of CSD entries for Cytenamide. Different polymorphs, as ascertained by structure matching of 20 molecule coordination sphere in Mercury, are coloured differently. Reference polymorphs are outlined in bold.
| REFCODE | Spacegroup | Z' | a / Å | b / Å | c / Å | α / ° | β / ° | γ / ° | density / g cm-3 | Form | R factor | T / K | Year | Comment / reference | REFCODE |
|---|---|---|---|---|---|---|---|---|---|---|---|---|---|---|---|
| SODNOP | P-1 | 4.0 | 5.81000 | 19.6315 | 21.7087 | 85.918 | 86.164 | 84.482000 | 1.2737 | None | None | at 293 K | 2008 | 10.1039/b719717a | SODNOP |
| SOGLEG | R-3 | 1.0 | 33.9078 | 33.9078 | 5.67540 | 90.0 | 90.0 | 119.99999 | 1.2444 | None | 7.100 | at 120 K | 2008 | 10.1039/b719717a | SOGLEG |
The Word Document also contains crystallization conditions.
Other Notes
Form I (SOGLEG) is isostructural with carbamazepine form II.
Form II (SODNOP) is isostructural with carbamazepine form I and cyheptamide form II.
There is also a comparison of the packings.
© UCL Chemistry Department 2022. This page was last updated on 30 Sep 2026. If you have any problems with this page please email the WebMaster