(Last updated 18 November 2024)
Figure . The molecular diagram of Fenamic Acid.
This system was studied by Ogaga Uzoh, as part of his PhD. He ran a search in CrystalPredictor, followed by CrystalOptimizer refinement and PCM refinement. At the moment, I don’t know which versions of CrystalPredictor or CrystalOptimizer were used, or whether the search was rigid or flexible. Looking at the summary.out files, the variation in starting values of dih9 and dih17 is very small, but they are all different values. Therefore, it looks like a flexible search. Similarly, the variation in bnd2 is small, so it appears to have been a CrystalPredictor2 search (CrystalPredictor1 would have this bond within a rigid fragment being a constant). It’s definitely CrystalOptimizer refinement, although the gas phase energy of opt was not included in the mol.input file.
Very few structures were optimized with CrystalOptimizer, and even fewer had the PCM refinement added. A related search by Ogaga had to be repeated later for exactly this reason – in that case one of the experimental crystal structures was missed as it was slightly too high on the CrystalPredictor energy ranking.
While compiling the structures and information for the energy comparison paper, it was noticed that different angles were optimized with CrystalOptimizer for each of the molecules in this family. Also, structurally equivalent packings were to be included for the whole family of molecules. This necessitated reoptimization with CrystalOptimizer prior to optimization with CASTEP.
| REFCODE | QQQBTY |
|---|---|
| Formula | C13 H11 N1 O2 |
| Common Name | Fenamic Acid |
| IUPAC Systematic Name | 2-(phenylamino)benzoic acid |
| Other Names | N-phenyl-anthranilic acid, 2-Aniliobenzoic Acid |
| CSD Refcodes | QQQBTY02 |
| Search Identifier | A |
| Scientist | Ogaga Uzoh |
| Date | 2012 |
| Publication | Uzoh OG, Cruz-Cabeza AJ, Price SL 2012. Cryst Growth Des 12, 4230-4239. DOI: Open paper (10.1021/cg3007348) |
| Energy Model | 1 |
| Study_ID | 10 |
| Programs | Flexible CrystalPredictor (1.6), dmaflex-Quick, CrystalOptimizer (2.2), DMACRYS (2.0.4) |
| Location on S Drive | /CHEMISTRY_CPOSS/Fenamates/FenamicAcid/QQQBTY_CO |
| Potential Description | CrystalOptimizer PBE1PBE/6-31+G(d) intramolecular energy with PBE1PBE/6-31+G(d) charge density and FIT potential |
| Energy Model | 2 |
| Study_ID | 30 (published) |
| Programs | Study_ID=10, DMACRYS (2.0.8) |
| Location on S Drive | /CHEMISTRY_CPOSS/Fenamates/FenamicAcid/QQQBTY_PCM |
| Potential Description | GDMA2.2(PCMdielectric3(PBE1PBE/6-31+G(d))) + FIT |
| Energy Model | 3 |
| Scientist | Louise Price |
| Date | 2024 |
| Study_ID | 11 |
| Programs | Study_ID=10, CrystalOptimizer (2.4.7), DMACRYS (2.3.1.1) |
| Location on S Drive | /CHEMISTRY_CPOSS/Fenamates/FenamicAcid/QQQBTY_DFT |
| Potential Description | CrystalOptimizer PBE1PBE/6-31+G(d) intramolecular energy with PBE1PBE/6-31+G(d) charge density and FIT potential |
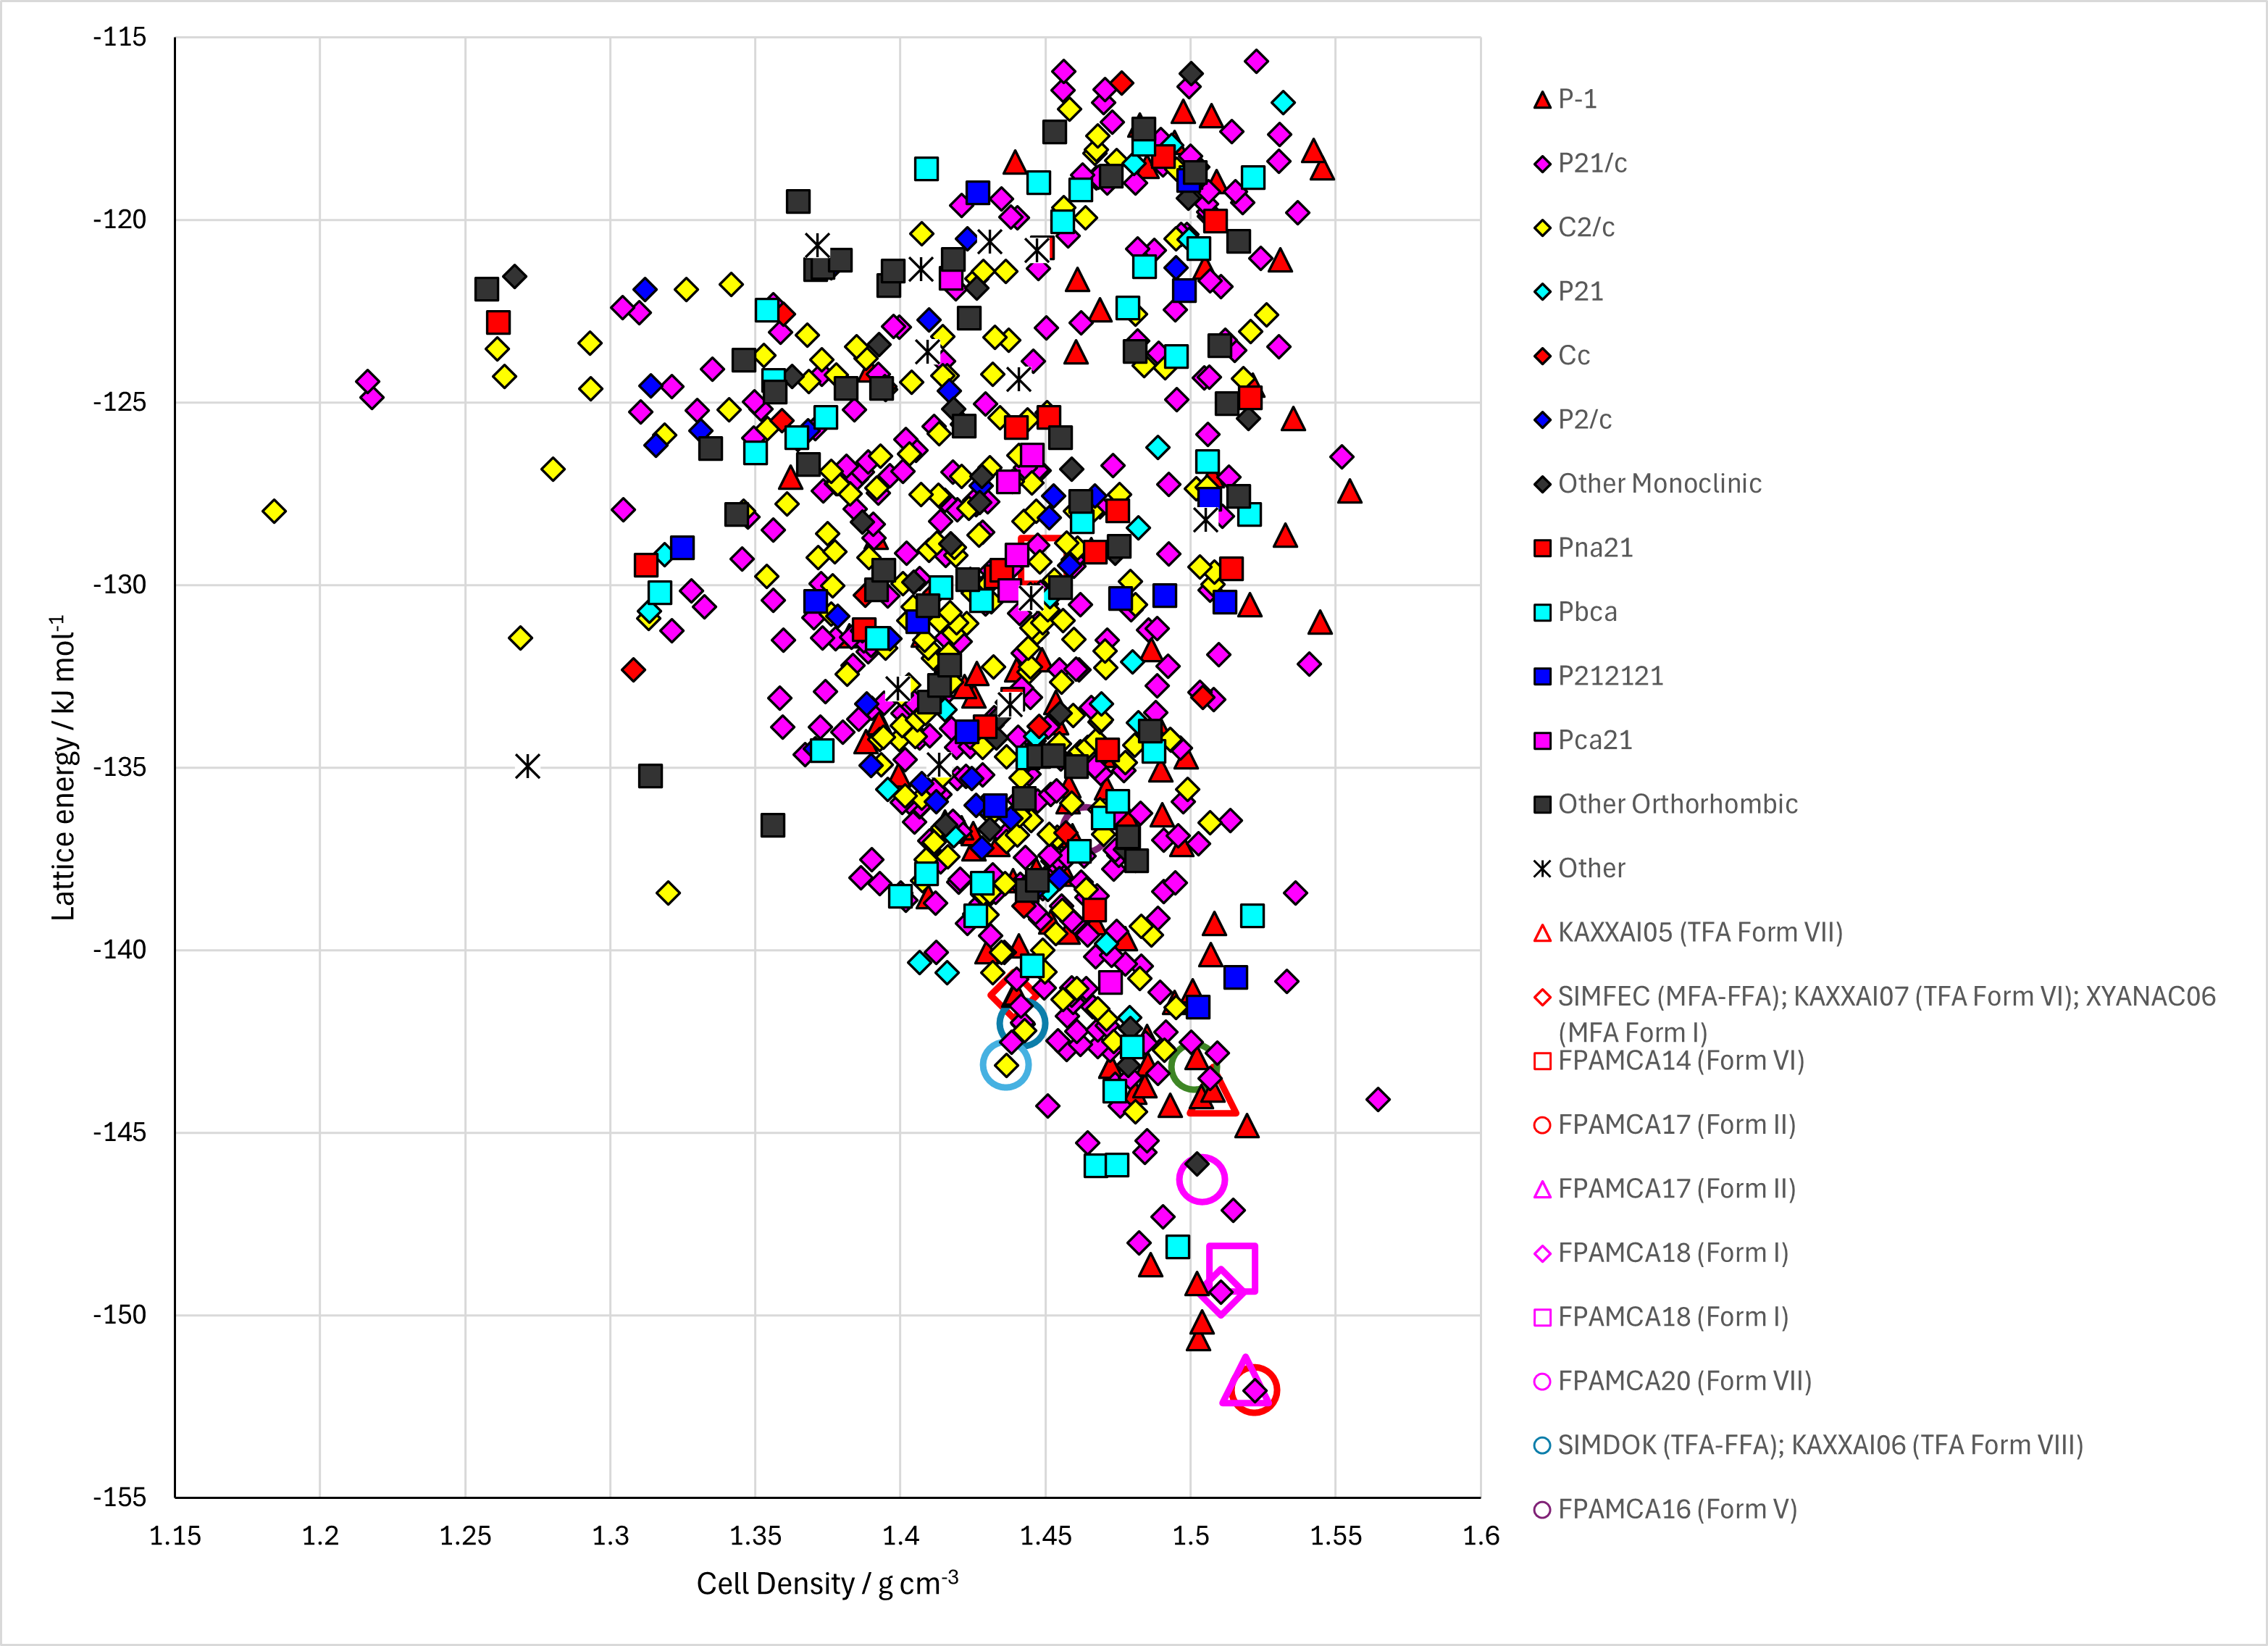
Figure . Top left: CrystalOptimizer crystal energy landscape of Fenamic Acid. Top right: PCM crystal energy landscape of Fenamic Acid. Bottom left: Reoptimized CrystalOptimizer crystal energy landscape. Bottom right: Energy comparisons with different models.
Table . Crystallographic information for CSD entries for Fenamic Acid. Different polymorphs are coloured differently.
| REFCODE | space group | Z’ | a / Å | b / Å | c / Å | α / ° | β / ° | γ / ° | density / g cm-3 | Form |
|---|---|---|---|---|---|---|---|---|---|---|
| QQQBTY | P-1 | 2 | 9.83 | 14.12 | 8.03 | 90.05 | 106.6 | 91.6 | 1.327 | I |
| QQQBTY01 | P-1 | 2 | 8.0995 | 9.8268 | 14.0593 | 85.96 | 88.62 | 73.39 | 1.324 | I |
| QQQBTY02 | P-1 | 2 | 8.08 | 9.812 | 14.043 | 85.96 | 88.64 | 73.45 | 1.33 | I |
Table . Experimental information for CSD entries for Fenamic Acid.
| REFCODE | space group | R factor | T / K | Year | Comments |
|---|---|---|---|---|---|
| QQQBTY | P-1 | 0 | RT | 1969 | Indian Journal of Physics, (1969), 42, p672 |
| QQQBTY01 | P-1 | 7.4 | RT | 1987 | Crystallized from a 50:50 ethanol acetone solution.1 |
| QQQBTY02 | P-1 | 4.89 | 293 | 2009 | Sublimation2 |
The original study indicated that structure 22 was a reasonable approximation to the experimental Z’=2 structure. Louise thinks that structures 2 and 58 are closer. For the time being, nothing is marked as the experimental structure apart from the Z’=2 structure.
This needs to be expanded on.
Figure . The packing in CSD entry QQQBTY, showing the slightly different ring orientations in the two crystallographically independent molecules.
Of the 77 CSP-generated crystal structures on the CrystalOptimizer landscape, all have $R22(8)$ hydrogen bonding apart from structures 249, 352, 415, 450, which have $C114$ hydrogen bonding, and structure 5675 which has $R22(12)$ hydrogen bonding (NH···O=C).
| df415, Elatt=-119.731 kJ mol-1 (+10.28 kJ mol-1) | df5675, Elatt=-109.158 kJ mol-1 (+20.85 kJ mol-1) |
|---|
Figure . The alternative hydrogen bonding motifs in fenamic acid CSP-generated structures.
1. M. Sbit, L. Dupont, O. Dideberg, J. F. Liegeois and J. Delarge, Acta Crystallographica Section C, 1987, 43, 926-928.
2. T. Zhou, F. Li, Y. Fan, W. Song, X. Mu, H. Zhang and Y. Wang, Chemical Communications, 2009, 3199-3201.